NYC 311 Service Quality & Operational Performance Dashboard
End-to-end analytics engagement on 5M+ NYC 311 requests. PostgreSQL star schema, true backlog (as-of) modeling, operational KPIs, and a multi-page Power BI dashboard with agency drill-through.
◉ An end-to-end operational analytics project that transforms NYC Open Data 311 requests into a structured warehouse + performance dashboard for monitoring service demand, backlog risk, SLA compliance, and agency/borough bottlenecks.
◉ This project mirrors a real analyst workflow: API ingestion → SQL modeling → star schema → Power BI semantic layer → executive-ready reporting.
◉ Quick Links
- GitHub Repo
- Video Walkthrough: Coming Soon
- PBIX Download (Google Drive)
- Docs:
◉ Business Context
NYC’s 311 system processes millions of service requests annually across agencies (housing, sanitation, noise, infrastructure, etc.).
City leadership and agency managers need consistent visibility into:
- Volume trends & seasonality
- Resolution efficiency
- SLA compliance (≤ 7 days proxy)
- Backlog growth and operational risk
- Borough-level hotspots
- Agency bottlenecks and long-tail cases
Raw 311 data is large and not decision-ready. This project cleans, models, and operationalizes the data into a repeatable analytics workflow and monitoring dashboard.
◉ What I Built
-
PostgreSQL Analytics Warehouse (Star Schema)
- Fact table:
fact_311_requests(grain: 1 row per request) - Dimensions:
dim_date,dim_agency,dim_complaint_type,dim_borough - Indexed for BI performance
- Fact table:
-
True Historical Backlog Modeling (As-Of-Date Logic)
- Backlog at date D is computed as:
created_date ≤ D AND (closed_date IS NULL OR closed_date > D) - This reconstructs backlog historically (not just “currently open tickets”) and supports backlog growth analysis.
- Backlog at date D is computed as:
-
Power BI Dashboard (Multi-page)
- Executive overview: KPIs, volume trend, top complaints, agency performance table
- Operational trends: rolling 7-day volume, true backlog (as-of), resolution-time trend
- Borough deep dive: backlog concentration + SLA and resolution disparities
- Agency drill-through: performance + complaint mix + resolution distribution
-
SQL Analytics Layer
- 10 production-style SQL scripts covering volume, SLA, rolling averages, ranking, backlog reconstruction, and outlier detection.
◉ Dashboard Preview
-
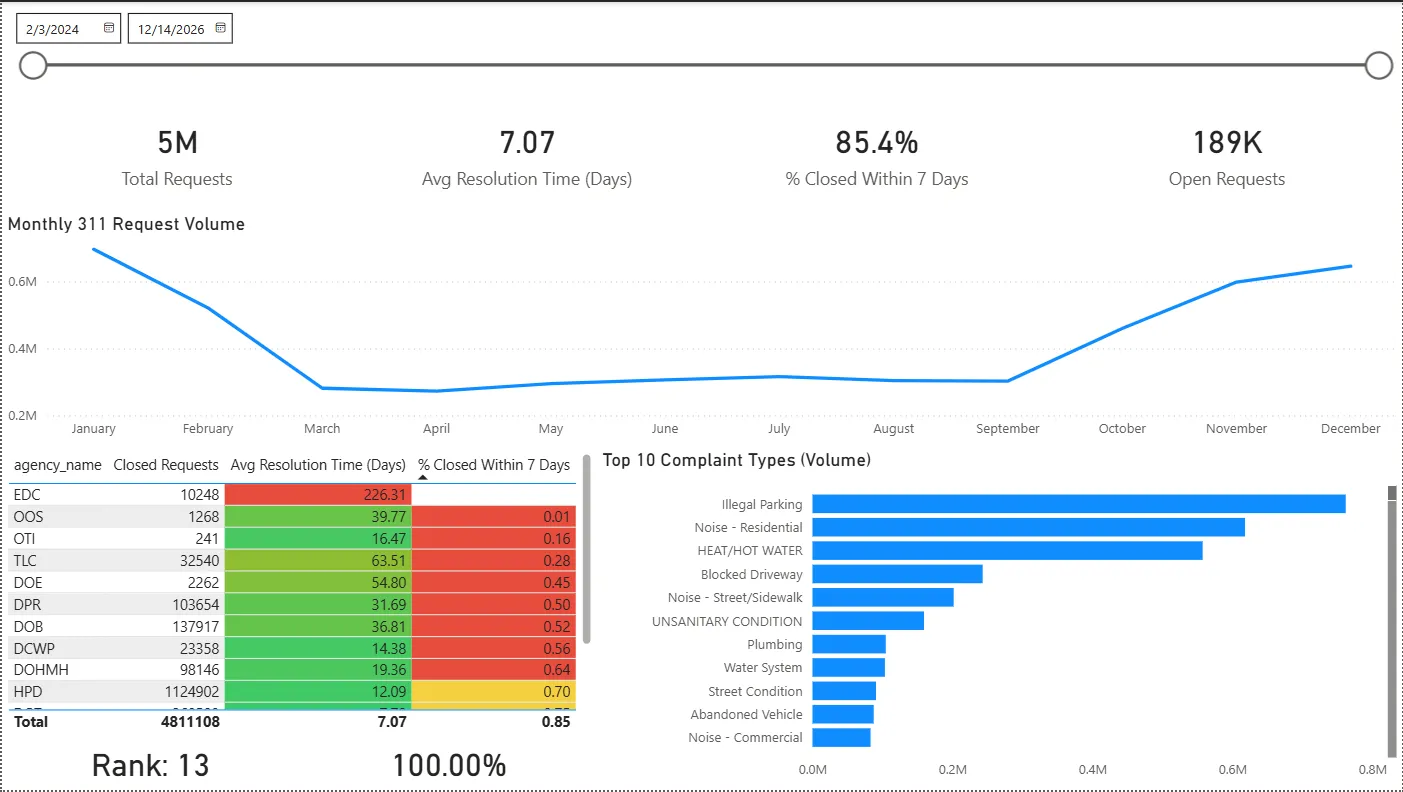
Executive Overview
-
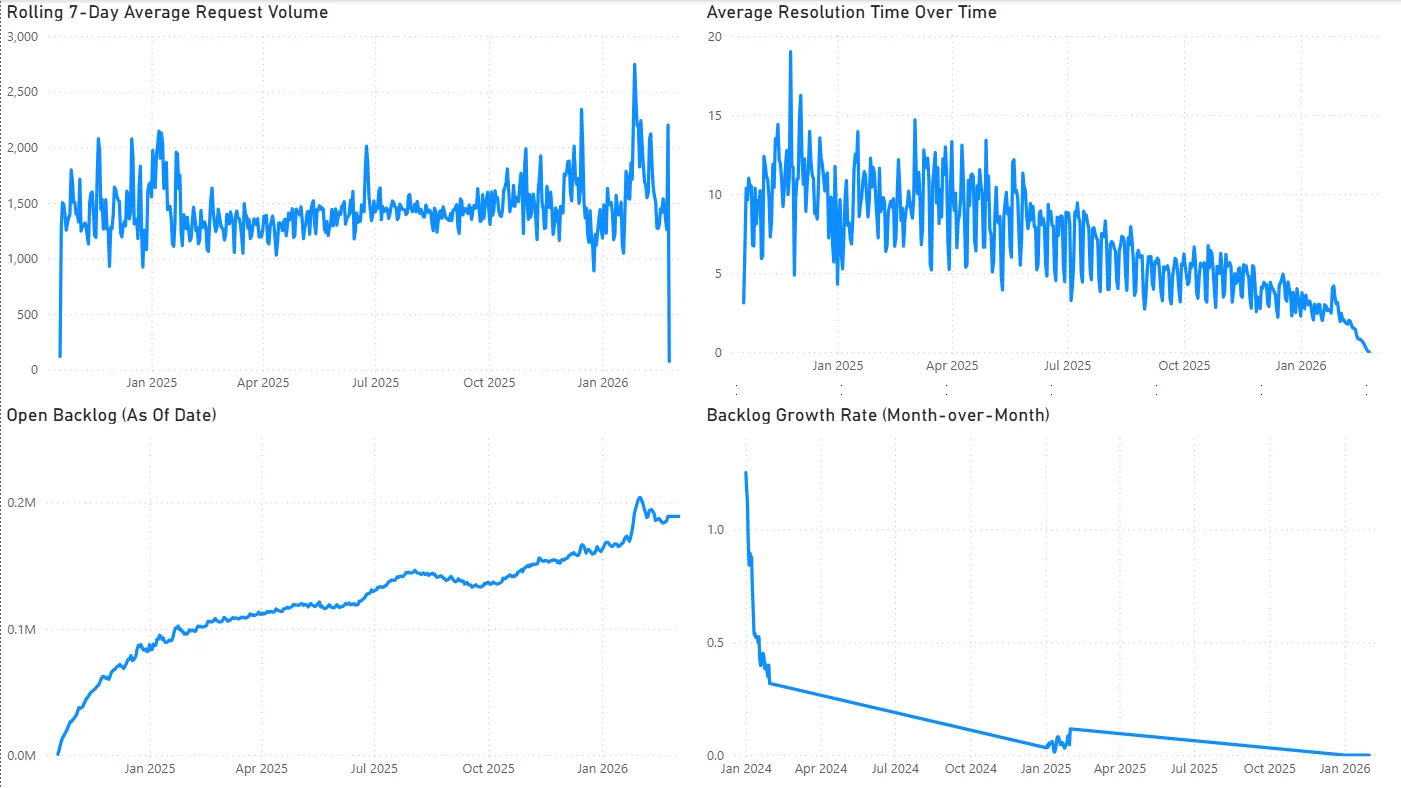
Operational Trends
-
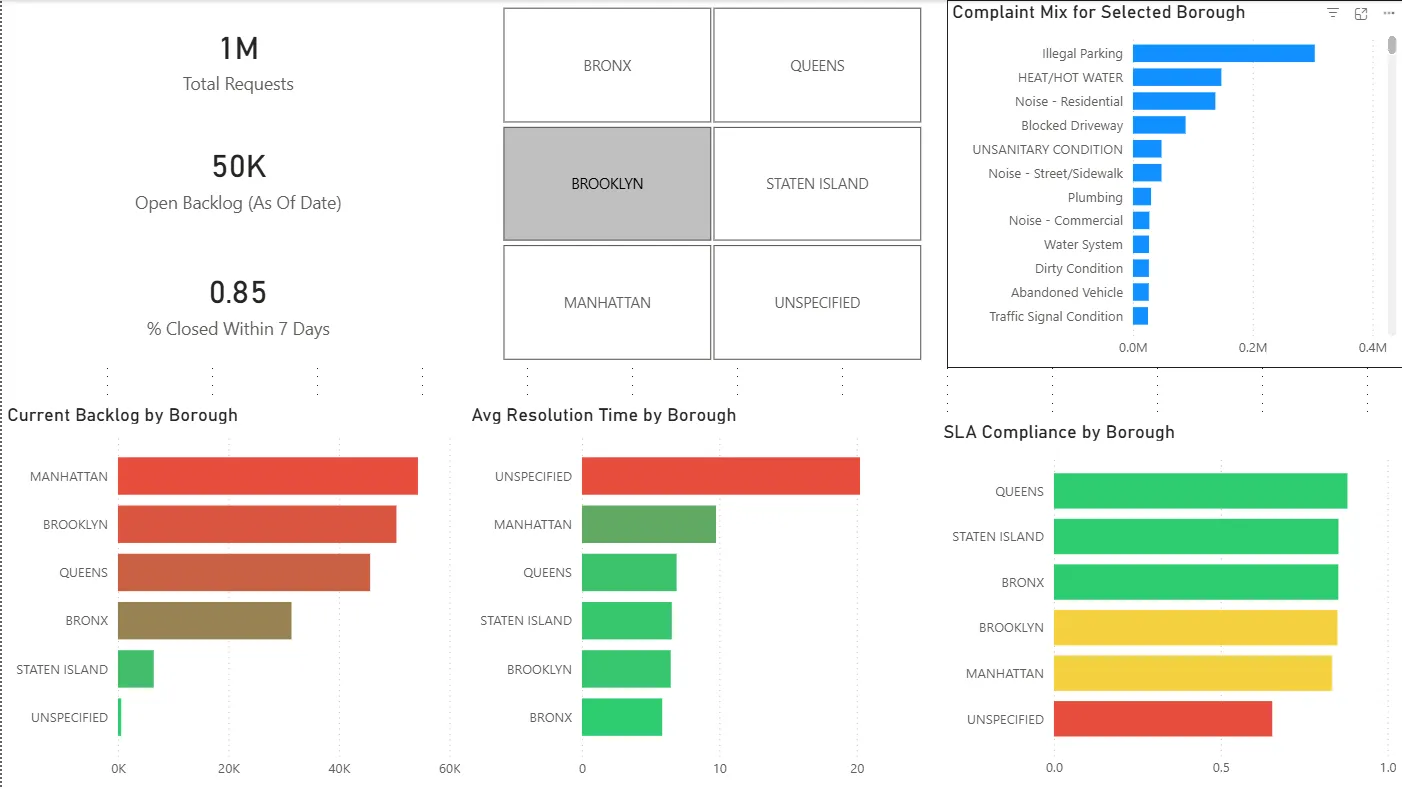
Borough Deep Dive
-
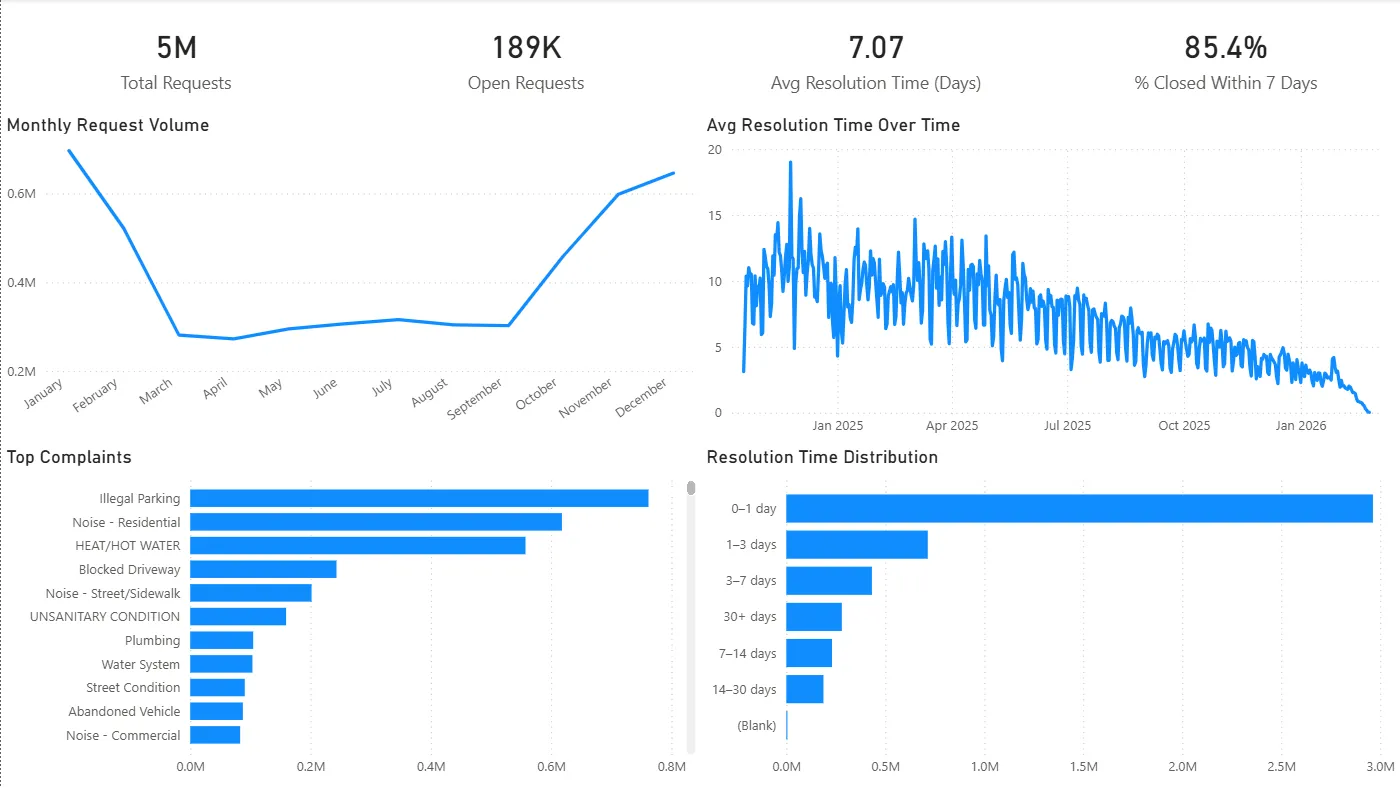
Agency Drill-Through
(See the video walkthrough for a guided tour.)
◉ KPIs Tracked
- Total Requests
- Open Requests
- Closed Requests
- Avg Resolution Time (Days) (uses cleaned resolution values)
- Median Resolution Time (Days)
- % Closed Within 7 Days (SLA proxy)
- True Backlog (As-Of Date)
- Rolling 7-Day Avg Requests
- Backlog Growth MoM (%)
- Agency SLA Rank
Full definitions and DAX formulas are documented in: KPI Definitions.
◉ Key Findings (Selected)
- Backlog grew steadily through 2025 even as average resolution time improved — suggesting intake growth outpaced closure capacity.
- Backlog concentration is not evenly distributed across boroughs; Manhattan shows especially high backlog levels relative to demand.
- Agency performance varies sharply, and some agencies exhibit long-tail resolution behavior (>30 days) that inflates backlog risk.
- EDC case study: exceptionally high average resolution time driven by long-duration cases and a concentrated complaint mix.
Full write-up (with recommendations): Insights and Recommendations.
◉ Tech Stack
- Database / Modeling: PostgreSQL (local)
- Analytics / KPI Layer: Power BI (DAX measures, drill-through)
- Ingestion: NYC Open Data API → CSV → PostgreSQL staging
- SQL Deliverables:
/sqlscripts (ranking, rolling averages, backlog reconstruction, SLA)
◉ Workflow
# 1) Pull data (API → CSV)
python pull_311.py

# 2) Load into PostgreSQL
# (Import CSV into stg.stg_311_raw)

# 3) Build warehouse (dims + fact)
# (SQL scripts in repo /docs or setup notes)

# 4) Open Power BI
# Connect to PostgreSQL → refresh → interact with dashboard