How I Approach EDA - My Personal Workflow
November 18, 2025
A walkthrough of my personal EDA workflow -> the questions I ask, the steps I follow, the mistakes I’ve learned from, and how I turn raw datasets into real insights.
Hello!
If you’ve read my earlier posts, you know two things about me already:
- I rebuilt my portfolio because I wanted a place to share my work as I actually do it.
- All the websites that I frequently visit to look for a suitable dataset for my work.
So, in this blog post, I decided to write about the next logical step, which is –
What I actually do once I have a dataset in my hands.
This is the workflow I follow every time (or at least try to, because every so often I did come across such a problem statement, where this order of steps will not exactly work, and I had to make some tweaks, or find new ways to get moving); whether I’m building a machine learning model, exploring a new topic, or just doing a late-night “let me see what this dataset looks like” session.
This isn’t meant to be a perfect or universal process.
It’s MY process, one that evolved through many mistakes, many notebooks, and many confusing CSVs.
Let’s get into it.
1. Start With a Question, Not the Data
For years I used to open a dataset and immediately dive into df.describe() and df.info().
It worked but I always ended up lost.
Now I start with something much simpler.
“What do I want to learn from this dataset?”
Examples:
- “Is there a pattern in customer churn?”
- “How do NYC subway delays vary by line?”
- “Which exoplanets look remotely habitable?”
- “Can I predict house prices with a simple model?”
This question becomes my guide and helps me navigate the process.
2. Get the Lay of the Land (The First 10 Minutes)
This is my warm-up routine.
df.head()
df.info()
df.describe(include='all')
# Use df.describe(include='object') or df.describe(include='category') depending on context.
df.shape
I purposely don’t try to understand everything yet.
I’m just trying to get a sense of:
- How big is this dataset?
- Are there categorical columns?
- Do the numeric columns look reasonable?
- Are there weird values that should not exist?
It’s like walking through a new apartment before deciding where the furniture goes.
3. My Mental EDA Checklist
This took me the longest time to develop, but now I try to stick to it.
Think of it as:
- What I check, in this order, always.
1) Missing Values -
I start with a simple table:
df.isnull().sum()Questions I ask myself:
- Are the missing values meaningful or just noise?
- Should I drop them, fill them, or create a new feature?
I will later on write a separate blog post about handling missing values, because of its significance.
I would also like to point out that missing values do not always hurt model performance and some tree-based models (XGBoost, LightGBM, CatBoost) handle them natively.
2) Data Types -
This sounds boring, but it has saved me countless headaches.
- Are dates stored as strings?
- Are IDs stored as numbers?
- Are categorical columns numeric?
If something feels wrong, it usually is.
Also, majority of the publicly available datasets have information section somewhere near the download link, which tells us the feature, as well as its data type and a brief description. So just make sure to refer to that!
3) Basic Distributions -
Histograms, box plots, KDEs, basically anything that helps me see the shape of the data. You’d be surprised how often a single plot changes your entire approach.
4) Outliers -
Outliers are like plot twists in a movie, sometimes they’re noise, sometimes they’re the whole story.
I look for:
- Extremely large values
- Negative values where there shouldn’t be any
- Repeated patterns
- Duplicates
Also, this is the point where you may want to revisit your problem statement, just to know the significance of the outliers.
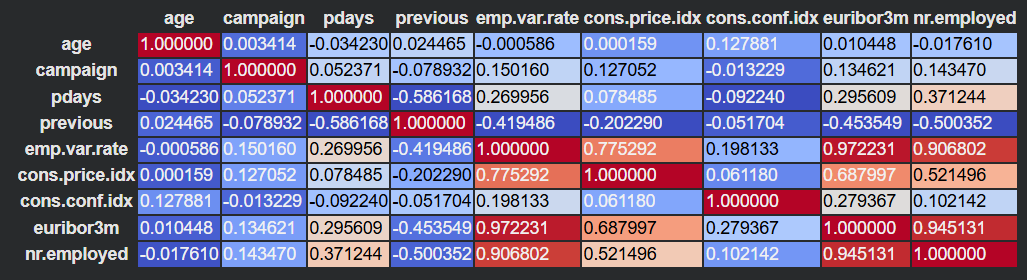
5) Correlations -
Not to confirm assumptions, but to break them.
This is the snippet that I usually use to generate a correlation heatmap of all the numeric features:
corr = df_numeric.corr()
corr.style.background_gradient(cmap='coolwarm')
An example visualization, as you can see, colored cells as well as the numeric values gives a really good idea of the correlation between the features:
You can also use VIF (Variance Inflation Factor), to detect multicollinearity in regression settings.
6) Feature Relationships -
Scatter plots, pairplots, groupby tables.
This is where ideas start forming.
4. The Part Everyone Forgets: Asking New Questions
EDA isn’t linear.
It’s exploratory for a reason.
When I find something interesting, I pause and ask:
- Why is this column distributed like this?
- Is this pattern consistent across groups?
- What happens if I isolate top/bottom 5%?
- Does this feature depend on time?
These new questions often become mini-projects inside the project, and trust me, this part is super important, because it’s this curiosity that makes any project stand apart.
5. Real Examples (The Fun Part)
These are some genuine “before/after” moments that changed my approach:
1) Example 1: Customer Churn Dataset -
Before: I assumed monthly charges affected churn linearly.
After: A scatter plot showed a bimodal distribution, there were two types of customers entirely.
That plot alone changed my whole modeling approach.
2) Example 2: Airbnb NYC -
Before: I thought “price” would correlate strongly with location.
After: The strongest correlation was actually with “minimum nights” and “availability.”
Depending on the version of the dataset and filters, correlations vary, but in my analysis, minimum nights and availability came out strongest.
3) Example 3: Exoplanets Dataset -
Before: I assumed habitability would depend most on temperature.
After: Stellar radius affects luminosity and thus habitability indirectly.
6. Mistakes I Made When I Started (That You Can Avoid)
I want this blog to feel honest and helpful, so here are the mistakes that cost me the most time:
Mistake 1: Diving into modeling too fast
- You waste time tuning a model that’s learning nothing.
Mistake 2: Ignoring domain context
- Just because the numbers look fine doesn’t mean they mean something.
Mistake 3: Trusting correlation too much
- Correlation is a hint, not a conclusion. (Correlation is NOT causation!!!!)
Mistake 4: Cleaning data blindly
- Sometimes a “weird value” is actually the key insight.
Mistake 5: Not documenting anything
- Now I literally leave a trail of markdown comments in my notebooks.
7. When I Know I’m “Done” With EDA
Honestly… I’m never fully done.
But I stop exploring and start modeling when:
- I understand the distribution of key variables
- I know which features matter and which don’t
- I’ve identified major issues (missing values, outliers, leakage)
- I can clearly articulate the story of the dataset
- The assignment is near to the submission deadline :(
EDA gives me a mental map.
Modeling is just walking through it.
8. Final Thoughts
This workflow isn’t about rigid steps, it’s about curiosity.
EDA is the part of data science where you discover things, question your assumptions, and let the dataset surprise you.
If you’re new to data science, I hope this post gives you a starting point.
If you’re more experienced, I hope it feels familiar.
In future posts, I’ll dive deeper into some of these EDA steps and also discuss some of my recent projects, how I explored them, the mistakes I made, and the insights that changed the direction of the work.
If you made it this far, here’s a cookie 🍪
~Vibhav